
Customer acquisition cost: how much can you afford?
Before setting your ad budget, find out what you can pay per customer. Without it, you won't know if ads make a profit. Calculate it from your margin in ten minutes.
Google Ads reports one number, Analytics another, and your store a third. Here is why, and how to find out what your ads truly bring in.

Ad numbers exaggerate. Under its own marketing attribution rules, every ad platform takes credit for orders it touched in any way. Google Ads, Sklik (the ad platform of Seznam, the Czech search engine), and Meta can all count the exact same order as their own. You only see what your ads truly bring in from your store backend or accounting, plus simple tests that show what would have sold anyway.
Nearly every online store owner knows this: Google Ads and Analytics numbers do not match, and the store admin shows a third figure. Add up orders from every ad system and the total exceeds your actual sales. This is neither a bug nor fraud—each tool just counts by different rules. Below, we explain why these gaps happen, which number you can trust, and how three tests measure how many customers would arrive without ads. Use this to judge any agency report, including ours.
Google Ads, Google Analytics, and your store admin answer three different questions: your store admin shows actual sales, Analytics shows website behavior, and the ad platform shows purchases it claims credit for. Only the first number matches the money in your bank account.
Picture three furniture salespeople paid on commission. A customer tries a sofa with the first, checks fabrics with the second, and signs the order with the third. The store sold one sofa, yet all three log a sale. Ad platforms work the same way: each sees part of the customer journey and claims the whole purchase.
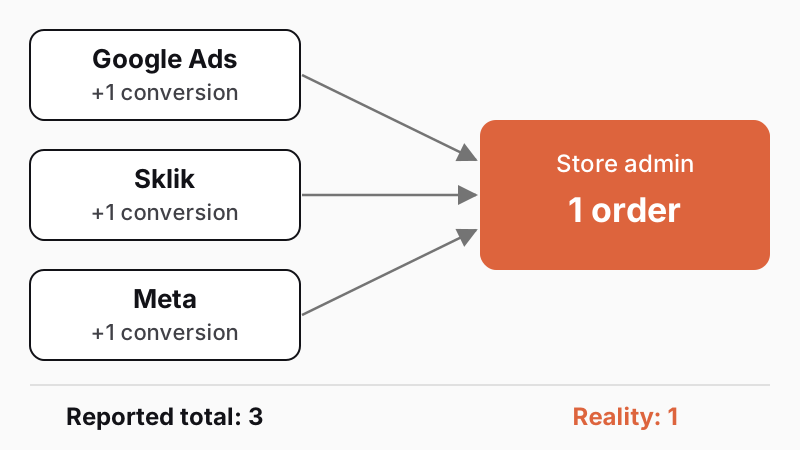
When a customer sees an ad on Facebook, clicks in Seznam search, and buys via Google, the sale appears in all three reports. Never add conversions across platforms. Take your overall total from your store admin or accounting, and use ad platforms only to compare campaigns within the same platform, where the same rules apply.
Each system also sets its own conversion window—how long after an ad click or view it still claims a purchase. The longer the window, the more purchases the platform counts. Always check conversion windows before comparing two platforms.
Marketing attribution is an agreement on how to split credit for a purchase across ads and channels on the customer journey. There is no single right model.
The simplest model is last click, which gives all credit to the final channel before purchase. Today, Google Analytics offers three models: data-driven attribution (which compares paths of buyers and non-buyers), paid and organic last click, and Google paid channels last click. First-click, linear, time-decay, and position-based models stopped working in November 2023, according to Google Analytics help.
Dates create gaps too. If someone clicks on Monday and buys on Friday, Google Ads logs the conversion on Monday (click date) while Analytics logs it on Friday (purchase date). According to Google Ads conversion help, differences of up to 20% from attribution models are normal.
Cross-device purchases (clicking on a phone, buying on a laptop at night) widen the gap further; Google estimates part of these using modeling. Finally, view-through conversions count people who saw an ad without clicking—Google Ads separates them, while other platforms may fold them straight into results.
| Cause of gap | What happens | What to do |
|---|---|---|
| Click vs. purchase date | Google Ads logs by click day, Analytics by purchase day | compare longer periods, not single days |
| Attribution model | each tool splits credit differently | check the model in each report |
| Cross-device buying | click on mobile, purchase on desktop | part of these links are modeled |
| View-through conversions | saw the ad, never clicked | track separately, do not add to sales |
| Rejected cookies | some sales go untracked, some are modeled | check the share of modeled conversions |
| Separate platforms | Google, Sklik, and Meta claim the same order | trust your store admin and MER |
No analytics tool measures every purchase directly because some shoppers reject cookies. Since January 1, 2022, Czech law—Section 89(3) of Act No. 127/2005 Coll., on Electronic Communications, the Czech form of the EU ePrivacy rule—requires prior user consent to store non-essential cookies.
Without consent, analytics and ad platforms normally cannot track the visitor. Google addressed this with Consent Mode, upgrading it in November 2023 to Consent Mode v2 (adding consent flags for ad user data and ad personalization) alongside stricter EU rules. For Google ad tools to work properly, your cookie banner must connect to this mode.
Consent Mode v2 uses modeling to estimate missing conversions, but it needs enough data. According to Google Analytics behavioral modeling help, a site must meet all of these conditions (and even then, modeling is not guaranteed):
Smaller online stores often miss these thresholds, leaving non-consented visits out of reports. Google Ads and Analytics also disagree because each handles missing data differently. Your store admin records every order regardless—use it as your source of truth.
A reliable metric is MER (marketing efficiency ratio): total store admin revenue divided by total marketing spend. It uses real revenue and real costs (ad spend, agency fees, email tools, shopping comparison sites), unaffected by cookies.
When MER rises, your marketing works. When MER falls even as ad dashboards report strong results, platforms are likely just claiming customers who would have bought anyway.
Model example: a made-up online cosmetics store over one month (rounded numbers for illustration).
| Monthly figure | Value |
|---|---|
| Store admin revenue | CZK 1,000,000 |
| Total marketing spend (ads, agency, tools) | CZK 100,000 |
| MER | 1,000,000 / 100,000 = 10 |
| Revenue claimed by Google Ads | CZK 600,000 |
| Revenue claimed by Meta | CZK 450,000 |
| Platform sum | CZK 1,050,000 (exceeds actual revenue) |
Here, the platform sum exceeds total store revenue—even though some buyers came directly, from email, or from organic search.
Track new customers in your store admin too. If ads mostly bring back repeat buyers, platform reports grow while your business stalls. Read more in Customer acquisition cost.
Incrementality means sales that would not happen without ads—the only real value advertising adds. Attribution tells you which ad a buyer clicked, not whether they would have bought without it.
Brand search campaigns illustrate this well. Anyone typing your brand name into Google is already looking for you. When they click the paid ad above organic results, the ad platform claims the sale even though they would have clicked the free link right below. Brand campaigns look great in reports yet drive few extra sales.
An eBay experiment confirmed this: in a May 2014 NBER study, economists Tom Blake, Chris Nosko, and Steven Tadelis found that eBay's brand search ads had no measurable short-term benefit, while frequent buyers accounted for most clicks on generic keywords. For a smaller brand whose competitors bid on its name, results can differ—so test it.
Remarketing (ads shown to past site visitors) works similarly. Many visitors would return on their own, yet the platform claims everyone who saw or clicked the ad.
Attribution therefore overestimates short-term direct effects, such as paid search.
Analyst Les Binet made this point in an October 2023 interview with MediaGuru. Paid search is not useless, but you need to test its real lift rather than copy numbers from a dashboard. Read more in our guides:
You measure incrementality with a test: turn ads off for part of your audience or regions, keep them running for the rest, and compare sales. As Les Binet notes, even smaller companies can run controlled experiments. These three tests need no expensive tools:
Run each test across at least one full buying cycle (longer for pricey items) and make sure you have enough orders. With only a few orders a week, a test takes longer or stays inconclusive. Write down start dates, changes, and outside events.
A good report states where numbers come from, how they were calculated, and what they mean for actual sales. Platform conversions and ROAS alone only show what ad systems claim for themselves. Ask five questions when reading a report.
A solid agency answers plainly—and that applies to us too. Alongside platform metrics, a report should show MER and new customer trends. When an agency proposes a bigger budget, it should state how it will test the sales lift. We cover splitting spend between brand and performance in Marketing budget.
A useful monthly report fits on one page:
We evaluate our marketing campaigns against real sales. If you want a second look at your ad numbers, get in touch.
Each tool counts differently. Google Ads assigns conversions to the click date, while Analytics uses the purchase date. They also differ in attribution models, cross-device tracking, and how they handle rejected cookies. According to Google, discrepancies of up to 20% from attribution models are normal.
Incrementality is the share of sales that would not happen without advertising. Marketing attribution shows which ad a buyer clicked, whereas incrementality asks whether they would have bought anyway. You measure it by turning ads off for a holdout group or selected regions and comparing sales.
MER (marketing efficiency ratio) is total store revenue divided by total marketing costs (ad spend, agency fees, tools). If an online store makes CZK 1,000,000 in a month and spends CZK 100,000 on marketing, its MER is 10. Because it uses real money, it does not depend on attribution or cookies.
It depends. A 2014 eBay study found brand search ads delivered no measurable short-term lift—shoppers would have found the site anyway. Yet if competitors bid on your name, a brand campaign defends your traffic. A simple test gives the clearest answer: pause the campaign for a few weeks and watch total orders.
Handpicked topics for you
Before setting your ad budget, find out what you can pay per customer. Without it, you won't know if ads make a profit. Calculate it from your margin in ten minutes.
Base your total spend on customer economics. For splitting brand and performance, IPA's 60:40 average is a useful guide. Track brand strength free in twenty minutes a month.
Google drives four-fifths of Czech search visits; local search engine Seznam drives an eighth. See when to start on Google, when Sklik pays off, and how to test both in six weeks.
Google Ads reports one number, Analytics another, and your store a third. Here is why, and how to find out what your ads truly bring in.
Ad numbers exaggerate. Under its own marketing attribution rules, every ad platform takes credit for orders it touched in any way. Google Ads, Sklik (the ad platform of Seznam, the Czech search engine), and Meta can all count the exact same order as their own. You only see what your ads truly bring in from your store backend or accounting, plus simple tests that show what would have sold anyway.
Nearly every online store owner knows this: Google Ads and Analytics numbers do not match, and the store admin shows a third figure. Add up orders from every ad system and the total exceeds your actual sales. This is neither a bug nor fraud—each tool just counts by different rules. Below, we explain why these gaps happen, which number you can trust, and how three tests measure how many customers would arrive without ads. Use this to judge any agency report, including ours.
Google Ads, Google Analytics, and your store admin answer three different questions: your store admin shows actual sales, Analytics shows website behavior, and the ad platform shows purchases it claims credit for. Only the first number matches the money in your bank account.
Picture three furniture salespeople paid on commission. A customer tries a sofa with the first, checks fabrics with the second, and signs the order with the third. The store sold one sofa, yet all three log a sale. Ad platforms work the same way: each sees part of the customer journey and claims the whole purchase.
When a customer sees an ad on Facebook, clicks in Seznam search, and buys via Google, the sale appears in all three reports. Never add conversions across platforms. Take your overall total from your store admin or accounting, and use ad platforms only to compare campaigns within the same platform, where the same rules apply.
Each system also sets its own conversion window—how long after an ad click or view it still claims a purchase. The longer the window, the more purchases the platform counts. Always check conversion windows before comparing two platforms.
Marketing attribution is an agreement on how to split credit for a purchase across ads and channels on the customer journey. There is no single right model.
The simplest model is last click, which gives all credit to the final channel before purchase. Today, Google Analytics offers three models: data-driven attribution (which compares paths of buyers and non-buyers), paid and organic last click, and Google paid channels last click. First-click, linear, time-decay, and position-based models stopped working in November 2023, according to Google Analytics help.
Dates create gaps too. If someone clicks on Monday and buys on Friday, Google Ads logs the conversion on Monday (click date) while Analytics logs it on Friday (purchase date). According to Google Ads conversion help, differences of up to 20% from attribution models are normal.
Cross-device purchases (clicking on a phone, buying on a laptop at night) widen the gap further; Google estimates part of these using modeling. Finally, view-through conversions count people who saw an ad without clicking—Google Ads separates them, while other platforms may fold them straight into results.
| Cause of gap | What happens | What to do |
|---|---|---|
| Click vs. purchase date | Google Ads logs by click day, Analytics by purchase day | compare longer periods, not single days |
| Attribution model | each tool splits credit differently | check the model in each report |
| Cross-device buying | click on mobile, purchase on desktop | part of these links are modeled |
| View-through conversions | saw the ad, never clicked | track separately, do not add to sales |
| Rejected cookies | some sales go untracked, some are modeled | check the share of modeled conversions |
| Separate platforms | Google, Sklik, and Meta claim the same order | trust your store admin and MER |
No analytics tool measures every purchase directly because some shoppers reject cookies. Since January 1, 2022, Czech law—Section 89(3) of Act No. 127/2005 Coll., on Electronic Communications, the Czech form of the EU ePrivacy rule—requires prior user consent to store non-essential cookies.
Without consent, analytics and ad platforms normally cannot track the visitor. Google addressed this with Consent Mode, upgrading it in November 2023 to Consent Mode v2 (adding consent flags for ad user data and ad personalization) alongside stricter EU rules. For Google ad tools to work properly, your cookie banner must connect to this mode.
Consent Mode v2 uses modeling to estimate missing conversions, but it needs enough data. According to Google Analytics behavioral modeling help, a site must meet all of these conditions (and even then, modeling is not guaranteed):
Smaller online stores often miss these thresholds, leaving non-consented visits out of reports. Google Ads and Analytics also disagree because each handles missing data differently. Your store admin records every order regardless—use it as your source of truth.
A reliable metric is MER (marketing efficiency ratio): total store admin revenue divided by total marketing spend. It uses real revenue and real costs (ad spend, agency fees, email tools, shopping comparison sites), unaffected by cookies.
When MER rises, your marketing works. When MER falls even as ad dashboards report strong results, platforms are likely just claiming customers who would have bought anyway.
Model example: a made-up online cosmetics store over one month (rounded numbers for illustration).
| Monthly figure | Value |
|---|---|
| Store admin revenue | CZK 1,000,000 |
| Total marketing spend (ads, agency, tools) | CZK 100,000 |
| MER | 1,000,000 / 100,000 = 10 |
| Revenue claimed by Google Ads | CZK 600,000 |
| Revenue claimed by Meta | CZK 450,000 |
| Platform sum | CZK 1,050,000 (exceeds actual revenue) |
Here, the platform sum exceeds total store revenue—even though some buyers came directly, from email, or from organic search.
Track new customers in your store admin too. If ads mostly bring back repeat buyers, platform reports grow while your business stalls. Read more in Customer acquisition cost.
Incrementality means sales that would not happen without ads—the only real value advertising adds. Attribution tells you which ad a buyer clicked, not whether they would have bought without it.
Brand search campaigns illustrate this well. Anyone typing your brand name into Google is already looking for you. When they click the paid ad above organic results, the ad platform claims the sale even though they would have clicked the free link right below. Brand campaigns look great in reports yet drive few extra sales.
An eBay experiment confirmed this: in a May 2014 NBER study, economists Tom Blake, Chris Nosko, and Steven Tadelis found that eBay's brand search ads had no measurable short-term benefit, while frequent buyers accounted for most clicks on generic keywords. For a smaller brand whose competitors bid on its name, results can differ—so test it.
Remarketing (ads shown to past site visitors) works similarly. Many visitors would return on their own, yet the platform claims everyone who saw or clicked the ad.
Attribution therefore overestimates short-term direct effects, such as paid search.
Analyst Les Binet made this point in an October 2023 interview with MediaGuru. Paid search is not useless, but you need to test its real lift rather than copy numbers from a dashboard. Read more in our guides:
You measure incrementality with a test: turn ads off for part of your audience or regions, keep them running for the rest, and compare sales. As Les Binet notes, even smaller companies can run controlled experiments. These three tests need no expensive tools:
Run each test across at least one full buying cycle (longer for pricey items) and make sure you have enough orders. With only a few orders a week, a test takes longer or stays inconclusive. Write down start dates, changes, and outside events.
A good report states where numbers come from, how they were calculated, and what they mean for actual sales. Platform conversions and ROAS alone only show what ad systems claim for themselves. Ask five questions when reading a report.
A solid agency answers plainly—and that applies to us too. Alongside platform metrics, a report should show MER and new customer trends. When an agency proposes a bigger budget, it should state how it will test the sales lift. We cover splitting spend between brand and performance in Marketing budget.
A useful monthly report fits on one page:
We evaluate our marketing campaigns against real sales. If you want a second look at your ad numbers, get in touch.
Each tool counts differently. Google Ads assigns conversions to the click date, while Analytics uses the purchase date. They also differ in attribution models, cross-device tracking, and how they handle rejected cookies. According to Google, discrepancies of up to 20% from attribution models are normal.
Incrementality is the share of sales that would not happen without advertising. Marketing attribution shows which ad a buyer clicked, whereas incrementality asks whether they would have bought anyway. You measure it by turning ads off for a holdout group or selected regions and comparing sales.
MER (marketing efficiency ratio) is total store revenue divided by total marketing costs (ad spend, agency fees, tools). If an online store makes CZK 1,000,000 in a month and spends CZK 100,000 on marketing, its MER is 10. Because it uses real money, it does not depend on attribution or cookies.
It depends. A 2014 eBay study found brand search ads delivered no measurable short-term lift—shoppers would have found the site anyway. Yet if competitors bid on your name, a brand campaign defends your traffic. A simple test gives the clearest answer: pause the campaign for a few weeks and watch total orders.
Handpicked topics for you
Before setting your ad budget, find out what you can pay per customer. Without it, you won't know if ads make a profit. Calculate it from your margin in ten minutes.
Base your total spend on customer economics. For splitting brand and performance, IPA's 60:40 average is a useful guide. Track brand strength free in twenty minutes a month.
Google drives four-fifths of Czech search visits; local search engine Seznam drives an eighth. See when to start on Google, when Sklik pays off, and how to test both in six weeks.